HOME
IC 1805
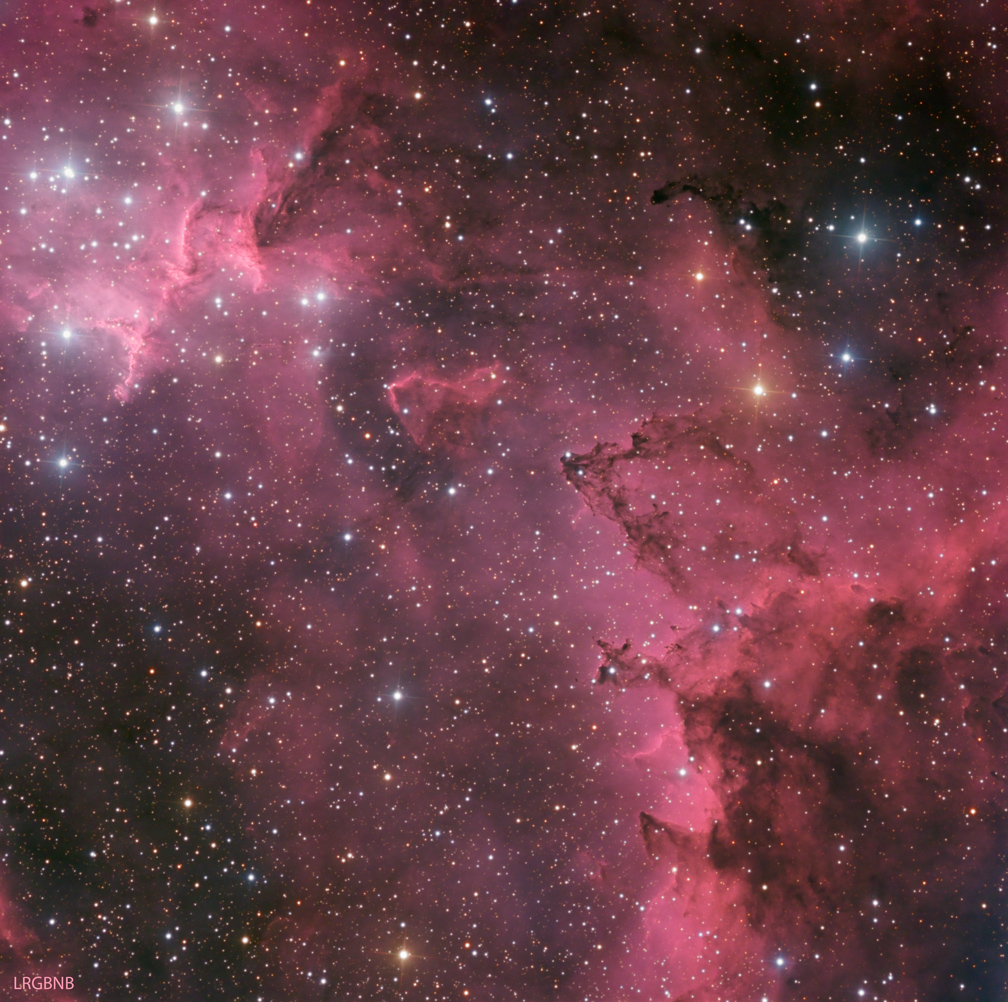
IC 1805 (Sharpless 190)
Heart of the Heart Nebula
Emission Nebula in Cassiopeia
Click here for higher-resolution versions: 40% (1612x1602) 65%
(2620x2604) 100% (4031x4006)
 Click on image to cycle through the five versions of the image (described below and labeled on the lower left corner of each image)
IC1805, also known as Sharpless 190, is a large emission nebula, in which star-forming is taking place. The emission nebula is predominantly red, because (i) ionized hydrogen
emits in the red part of the spectrum; (ii) the vast majority of the light matter in the universe is hydrogen, and (iii) the hydrogen near the new stars is being ionized (stripped of its electron)
by the highly-energetic young stars being formed in the star cluster (predominately those at the upper left of the image; the star cluster is called Melotte 15).
This image is a "close-up" of the central part of the much larger nebula. I imaged this 16 years earlier, with a smaller telescope (and chip); you can see in that larger field of view why the entire
nebula is called the "Heart Nebula." Click here to see the older version.
This nebula is about 7500 light years from Earth and is roughly 200 light years across; the portion shown in this photo is about 70 light years across. Visually, it is about the same width as a
full moon.
I have presented this object in five different formats (each image is labeled in the lower left corner), each a fairly common way to process this kind of data-set; I very much like each one in its
own way. This is the order in which they appear as you cycle through (by repeatedly clicking on the photo, waiting for each to download):
(i) A true-color version (LRGBNB, the top photo in the stack), with the color created by imaging through red, green and blue filters (with a significant amount of Ha and OIII
data blended into various channels, in varying percentages; Ha emissions are in the red spectrum, and OIII emissions are blue-green, so I have blended Ha into the luminance layer and the red channel,
and OIII into the green and blue channels).
(ii) A true-color version, without using any narrow band data (LRGB, all color is derived from data collected through red, green and blue filters, and the luminance layer
does not contain any Ha component), as a comparison to the result when loaded with NB data. The more I gaze at this version, the more I like it (especially the vibrant star colors).
(iii) A bi-color version (HOO, almost true-color version; the second photo in the stack), in which "red" is ionized hydrogen emissions (Ha), and the green and blue channels both
are doubly-ionized oxygen emissions (OIII), which are blue-green in color. It's a fair substitute for having red, green and blue channels, but, because the green and blue channels are the same, the
star colors are a bit wonky, heavily blue-green. I used the Ha master as the luminance (detail) layer. Yes, it lacks the depth and punch of the full color with narrowband version, but it only
uses a fraction of the data (so much quicker to complete gathering data), and those who image from heavily light-polluted areas can have more success with narrow band imaging than with broadband imaging.
(iv) A version in the Hubble palette (SHO, a lot of the Hubble photos, including and especially the famous "Pillars of Creation," are made with this set of filters, since
it's a useful set for scientists to see what's actually happening), which shows SII emissions as red, Ha emissions as green, and OIII emissions as blue. The luminance layer is the Ha master. Because
the green from the dominant Ha emissions can make this look odd, I have significantly de-emphasized the green.
(v) A pure Ha version (grayscale, showing only light in the very narrow Ha band); this is fun for me to gaze at in full resolution, to see all the detail in the structure.
Technical Information:
Ha:OIII:SII:L:R:G:B: 660:360:240:660:180:240:240 (a total of 43 hours of light-frame exposure time used in this photo); luminance, red and green exposures were all 15-minute exposures;
blue all 20-minute exposures; Ha, SII and OIII were all 30-minute exposures.
Equipment: RC Optical Systems 14.5 inch Ritchey-Chretien carbon fiber truss telescope, with ion-milled optics and RCOS field flattener, at about f/9, and an SBIG STX-16803 camera with
internal filter wheel (SBIG filter set), guided by an SBIG AO-X, all riding on a Bisque Paramount ME German Equatorial Mount.
Image Acquisition/Camera Control: Maxim DL, controlled with ACP Expert/Scheduler, working in concert with TheSky X.
Processing: All images calibrated (darks, bias and sky flats), aligned, combined and cropped in Pixinsight. Color combine in Pixinsight. Some finish work (background neutralization,
color calibration, NoiseXTerminator and BlurXTerminator) done in Pixinsight; some cleanup finish work was done in Photoshop CC.
Location: Data acquired remotely from Sierra Remote Observatories, Auberry, California, USA.
Date: Images taken on many nights from December 2022 through April 2023. Image posted August 20, 2023
Date: Image scale of full-resolution image: 0.56 arcseconds per pixel.
Seeing: Generally very good, with individual calibrated luminance frames varying from 1.6 to 2.2 arcsecond FWHM.
CCD Chip temperature: -25C
Copyright 2022, 2023 Mark de Regt