HOME
Sh2-88
Sh2-88 (Sharpless 88)
Emission Nebula in Vulpecula
Click here for higher-resolution versions: 40% (1587x1601) 65%
(2579x2602) 100% (3968x4004) 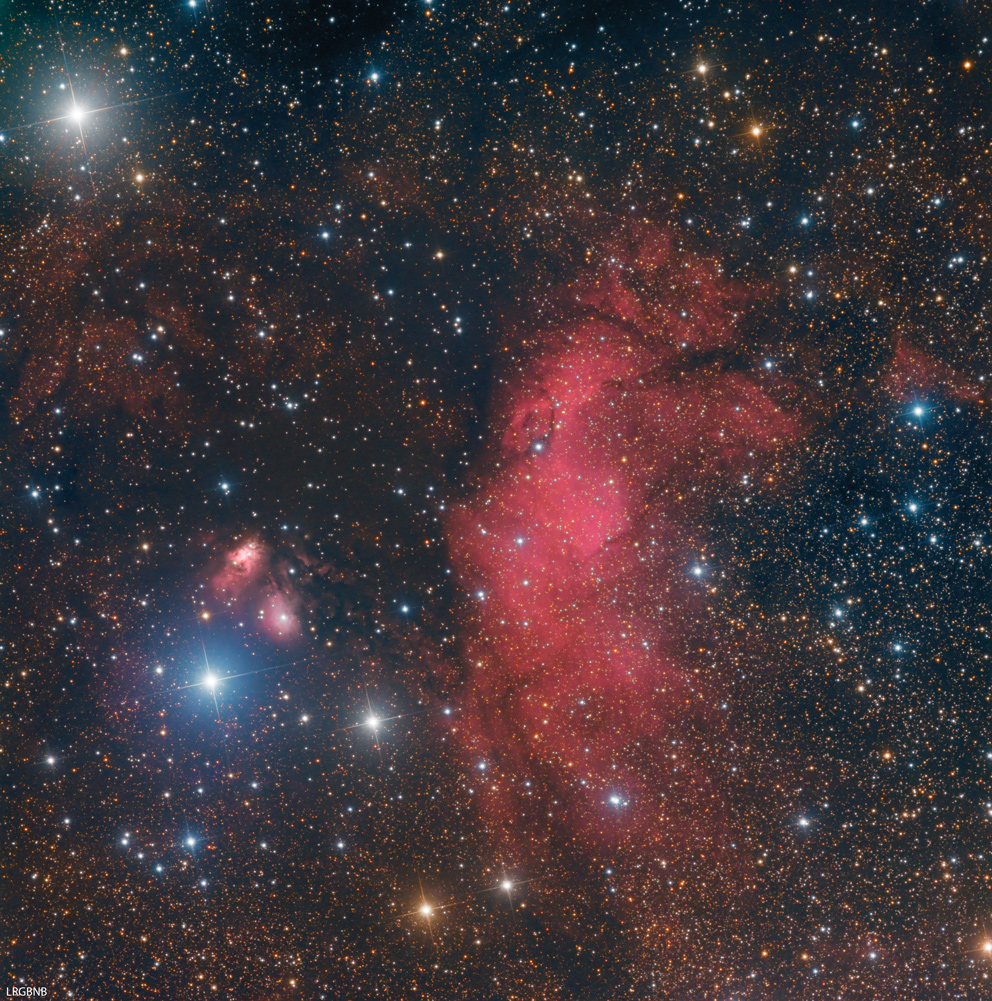 Click on image to cycle through the five versions of the image (described below and labeled on the lower left corner of each image)
Sh2-88, also known as Sharpless 88, is an emission nebula, in which star-forming is taking place. The emission nebula is predominantly red, because (i) ionized hydrogen
emits in the red part of the spectrum; (ii) the vast majority of the light matter in the universe is hydrogen, and (iii) the hydrogen near the new stars is being ionized (stripped of its electron)
by the highly-energetic young stars being formed in the star cluster.
This object is visually located in the plane of the Milky Way, which explains the immense number of stars in the field--we're looking through 7000 light years of stars at this region (not to mention many
thousands of light years of stars in our own galaxy beyond this region). The various versions of this image (see explanation just below) show significantly different amounts-and sizes--of stars, depending
on the mix of broad-band data (L, R, G and B, with, respectively, 300nm, 100nm, 100nm and 100nm of band pass), which allow a lot more light through than do the narrow-band filters (Ha has 7nm band pass;
OIII 8.5nm and SII 8nm). The current fashion is to eliminate or minimize stars, but I like a dense star field in an image, so I like the LRGBNB version (with predominantly broad-band data) better than
the HOO version (with only narrow-band data. And I prefer the LRGBNB over the pure LRGB version because of the way the narrow-band data make the nebular regions much more vivid.
To the left of the main nebula are two bright red blobs called Sh2-88A (below/right) and Sh2-88B(above/left). Sh2-88B is an active star forming region.
The main nebula is about 7000 light years from Earth and is roughly 60 light years across. Visually, it is about the same width as a full moon.
I have presented this object in five different formats (each image is labeled in the lower left corner); I very much like each one in its own way. This is the order in which they appear as you cycle
through (by repeatedly clicking on the photo, waiting for each to download); note that you can also click on the link in the Ha image to compare the Ha version to the OIII and SII versions:
(i) A true-color version (the top photo in the stack), with the color created by imaging through red, green and blue filters (with a significant amount of Ha and OIII
data blended into various channels, in varying percentages; Ha emissions are in the red spectrum, and OIII emissions are blue-green, so I have blended Ha into the luminance layer and the red channel,
and OIII into the green and blue channels).
(ii) A bi-color version (almost true-color version; the second photo in the stack), in which "red" is a mix of predominately ionized hydrogen emissions (Ha), with a bit of
singly-ionized sulfur emissions (SII) added (Ha and SII both emit in the red part of the spectrum), and the green and blue channels both are doubly-ionized oxygen emissions (OIII), which are
blue-green in color, with a bit of Ha added to the blue (because where there's hydroge-alpha--red--there also it hydrogen-beta, which is blue). It's a fair substitute for having red, green and blue
channels, but, because the green and blue channels are the same, there is a lot of blue-green color in the stars (which I have moderated by copying the stars from the true-color version above into this version).
Even without substituting RGB stars, it's interesting to me how close this came to the much more complex (with much more data) true-color version above, but with some less color breadth.
(iii) A true-color version, without using any narrow band data (all color is derived from data collected through red, green and blue filters), as a comparison to the
result when loaded with NB data.
(iv) A pure Ha version (grayscale, showing only light in the very narrow Ha band); this is fun for me to gaze at in full resolution, to see all the detail in the structure.
(v) A version in the Hubble palette (a lot of the Hubble photos, including and especially the famous "Pillars of Creation," are made with this set of filters, since
it's a useful set for scientists to see what's actually happening), which shows SII emissions as red, Ha emissions as green, and OIII emissions as blue (with the Ha emissions amost completely
de-emphasized in this rendition because they would be so dominant otherwise, with the entire nabula just being green). Consider that everything red in the first two images would be green in this one if
I had not largely ignored the Ha data; the yellow/brown parts of this one show sulfur emissions, and the blue show oxygen emissions.
These are the most frequent ways images of emission nebulae are likely to be presented, so I thought it would be fun to include all of them, to be able to compare and contrast the different presentations.
The "true color" version which includes narrow-band data is, to me, the most beautiful of the lot, so I put it at the top; the narrow-band data adds contrast and detail to the image, and makes
the stars smaller, which is pleasing to me, while maintaining the "true color" nature of the data. The Hubble palette version is also very pretty, and it's nice to include the (relatively sparse)
sulfur emissions that I spent a bunch of hours gathering.
The grayscale Ha image is, to me, striking in its smoothness (and the gray, of course, is the color you see when you look at this through a telescope); the other two grayscale images are interesting
on this target because all three are significant images, and it's fun to see how different each is from the others. The bicolor is there for comparison purposes,
since a lot of people use only those two filters when creating color images of diffuse nebulae. And the traditional LRGB, without using any narrow band data, also is for comparison purposes,
to show the benefits of including narrow-band data in a true-color image (compare to the top image).
Technical Information:
Ha:OIII:SII:L:R:G:B: 720:570:540:405:210:195:300 (a total of 49 hours of light-frame exposure time used in this photo); luminance, red and green exposures were all 15-minute exposures;
blue all 20-minute exposures; Ha, SII and OIII were all 30-minute exposures.
Equipment: RC Optical Systems 14.5 inch Ritchey-Chretien carbon fiber truss telescope, with ion-milled optics and RCOS field flattener, at about f/9, and an SBIG STX-16803 camera with
internal filter wheel (SBIG filter set), guided by an SBIG AO-X, all riding on a Bisque Paramount ME German Equatorial Mount.
Image Acquisition/Camera Control: Maxim DL, controlled with ACP Expert/Scheduler, working in concert with TheSky X.
Processing: All images calibrated (darks, bias and sky flats), aligned, combined and cropped in Pixinsight. Color combine in Pixinsight. Some finish work (background neutralization,
color calibration, deconvolution and mure noise reduction) done in Pixinsight; some cleanup finish work was done in Photoshop CC.
Location: Data acquired remotely from Deep Sky West Remote Observatory, Rowe, New Mexico, USA.
Date: Images taken on many nights in July, August and September 2020. Image posted September 14, 2020
Date: Image scale of full-resolution image: 0.56 arcseconds per pixel.
Seeing: Generally good, with individual calibrated luminance frames varying from 1.6 to 2.2 arcsecond FWHM.
CCD Chip temperature: -25C
Copyright 2020 Mark de Regt